

Overview
I have extensive experience leveraging various types of data to inform decision-making in the human-centered design process. My work integrates both qualitative and quantitative data to gain a comprehensive understanding of user needs, behaviors, and pain points.
The Influence of Data on Design
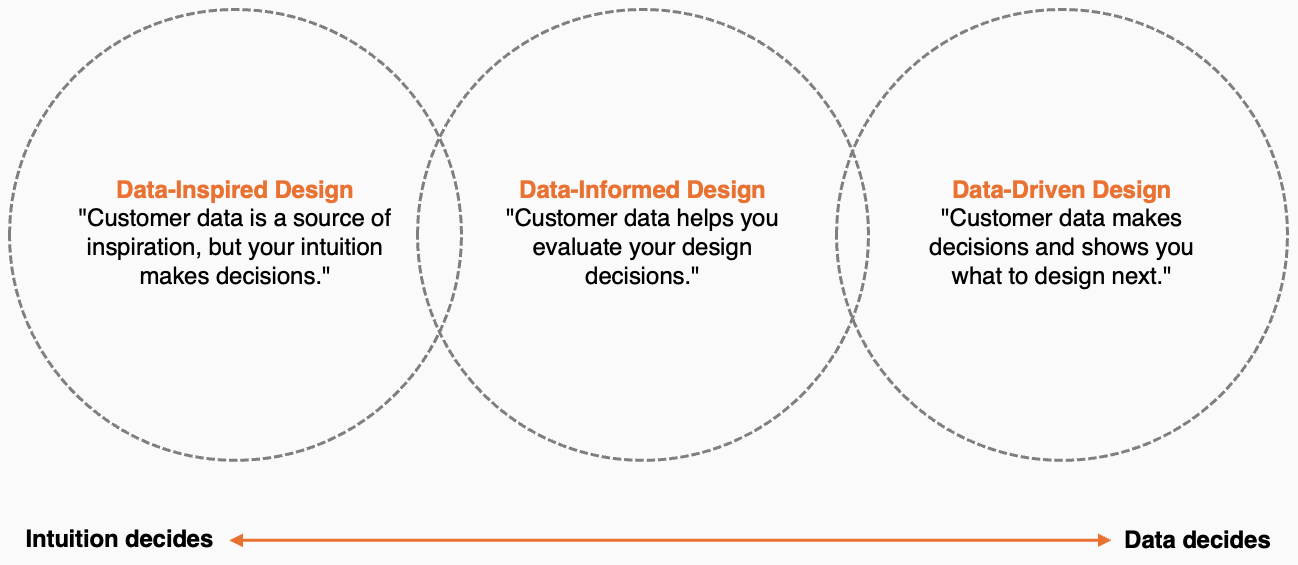
Image concept borrowed from this great article by Jeff Humble
Qualitative Data
I have utilized qualitative research methods to explore user experiences, mental models, and barriers to task completion. This includes:
User Interviews – To gather insights on adoption, usability, and feature desirability.
Heuristic Reviews – To identify usability issues and areas for improvement.
Task Analysis – To assess efficiency and friction points in workflows.
Focus Groups – To validate concepts and understand user expectations.
These qualitative methods are essential for identifying end-user pain points, assessing the desirability of new features or products, and conducting usability testing.
Examples
User Interviews
Conducted Boeing Maintenance Manager interviews to assess the desirability of digital maintenance training experiences.
What was learned and how it drove decision making: Learned that while interesting to maintenance managers, there were larger issues that they wanted Boeing’s leadership to address before they would consider adopting the product, effectively changing leadership’s roadmap.
Focus Groups
Participated in focus groups at American Greetings to better understand the needs a target demographic.
What was learned and how it drove decision making: Validated goals, needs, and pain points of key demographic, which gave the rest of the design workshop pain points to address for a design thinking exercise.

Focus group at American Greetings with Amanda Parkhurst
Task analysis
Led task analysis user interviews for OnRoute product at Zonar, gathering feedback to evaluate new feature desirability.
What was learned and how it drove decision making: Validated the hypothesis of route managers wanting a feature to help with absent bus drivers was extremely valuable.


Journey Mapping
Led a Journey Mapping effort to determine pain points for hardware installation for E.V.I.R.
What was learned and how it drove decision making: Validated the hypothesis that we needed different hardware software combination to ease installation and use of E.V.I.R. hardware/software

Quantitative Data
Quantitative Data
I have experience using various quantitative methods to uncover usability challenges, validate hypotheses, and optimize product experiences. These include:
Web Analytics – To track user interactions and identify pain points.
Surveys – To gather large-scale feedback and measure user satisfaction.
Tree Testing & Card Sorting – To optimize information architecture and navigation.
These data-driven insights help diagnose issues within existing products, refine product structures, and support evidence-based decision-making.
Examples
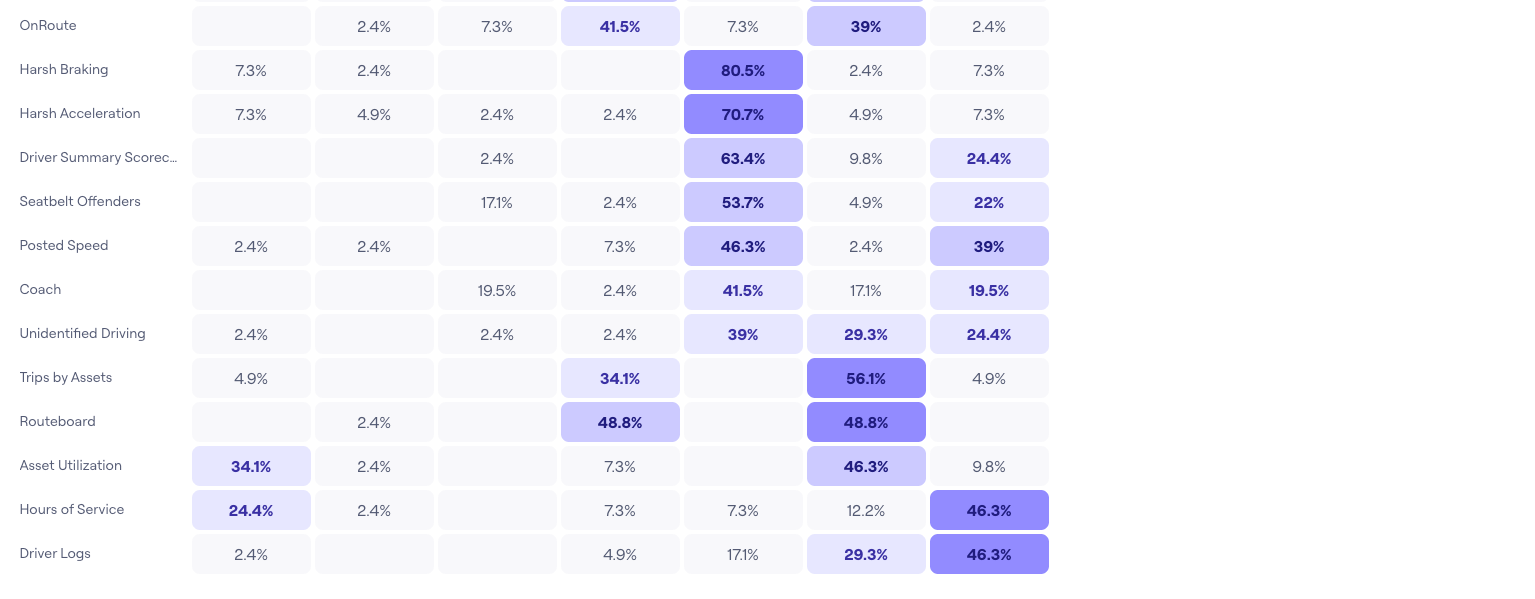
Utilized Maze.co for UX card sorting to enhance Zonar’s information architecture.
What was learned and how it drove decision making: Helped us understand our customers mental model in terms of how we should name and structure the new Information Architecture.
Card Sort

Web Analytics
Leveraged Pendo.io to analyze maintenance vs. diagnostics report usage and identify adoption friction points.
What was learned and how it drove decision making: Helped uncover product problems when we realized customers were not adopting the new product and were still returning to the legacy offering because it was providing value in ways that the new offering was not.

How are customers using the mobile experience?

Visit number is keeping up…

We can see that customers are utilizing the legacy report more. Why?
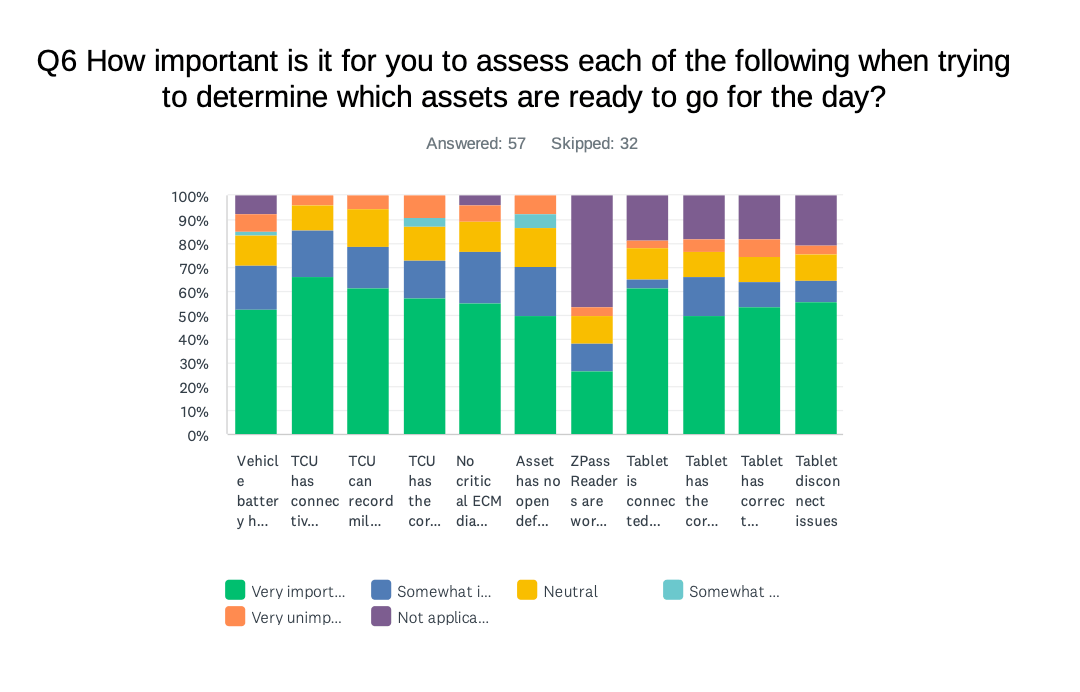
Surveys
Utilized Survey Monkey to understand the importance of potential feature to our customer
What was learned and how it drove decision making: We learned that the proposed feature had important aspects but was not actually the right combination of features to justify moving forward without iteration.
Results
By integrating qualitative and quantitative data, I ensure that design decisions are user-centric, validated, and strategically aligned with business goals.